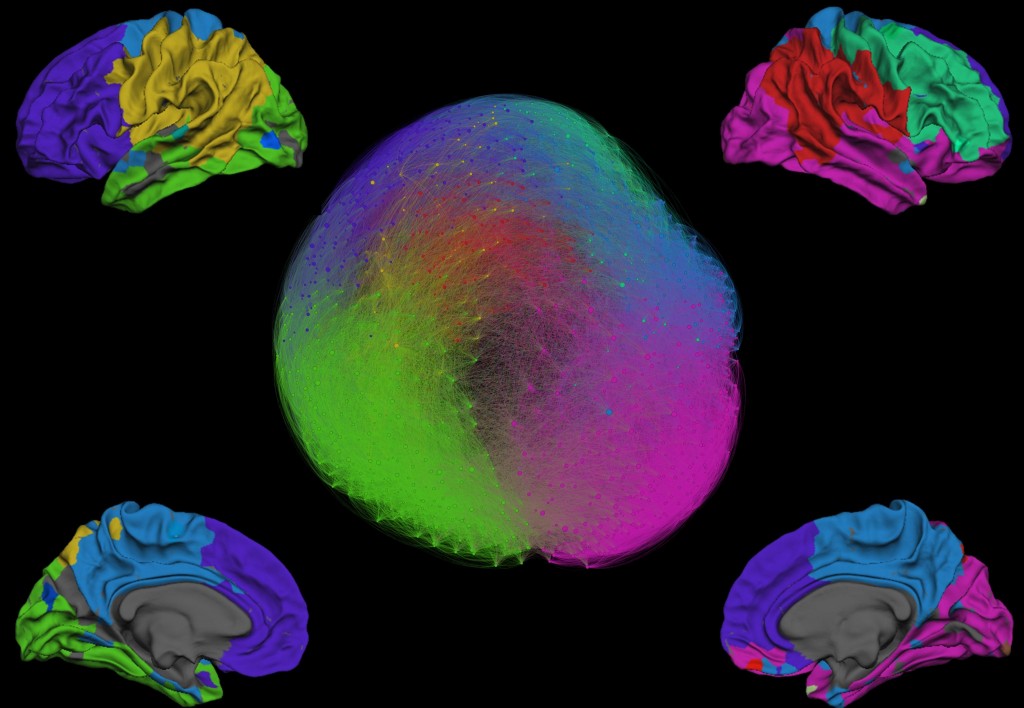
Modular architecture of human structural connectome
This figure shows structural connectivity data calculated from human subjects using Diffusion Tensor Imaging and white matter tractography. Each of 1000 cortical regions is represented as a node in a graph with edges representing connections to other brain regions. The size of each node is proportional to its number of connections. The seven colors in this figure represent seven modules, or sets of nodes which are more connected to other members of their own module than to members of other modules. These modules are also displayed on surface-based cortical models at the depth level of the gray-white matter junction to emphasize the anatomy of this modular architecture. than to members of other modules. These modules are also displayed on surface-based cortical models at the depth level of the gray-white matter junction to emphasize the anatomy of this modular architecture.

