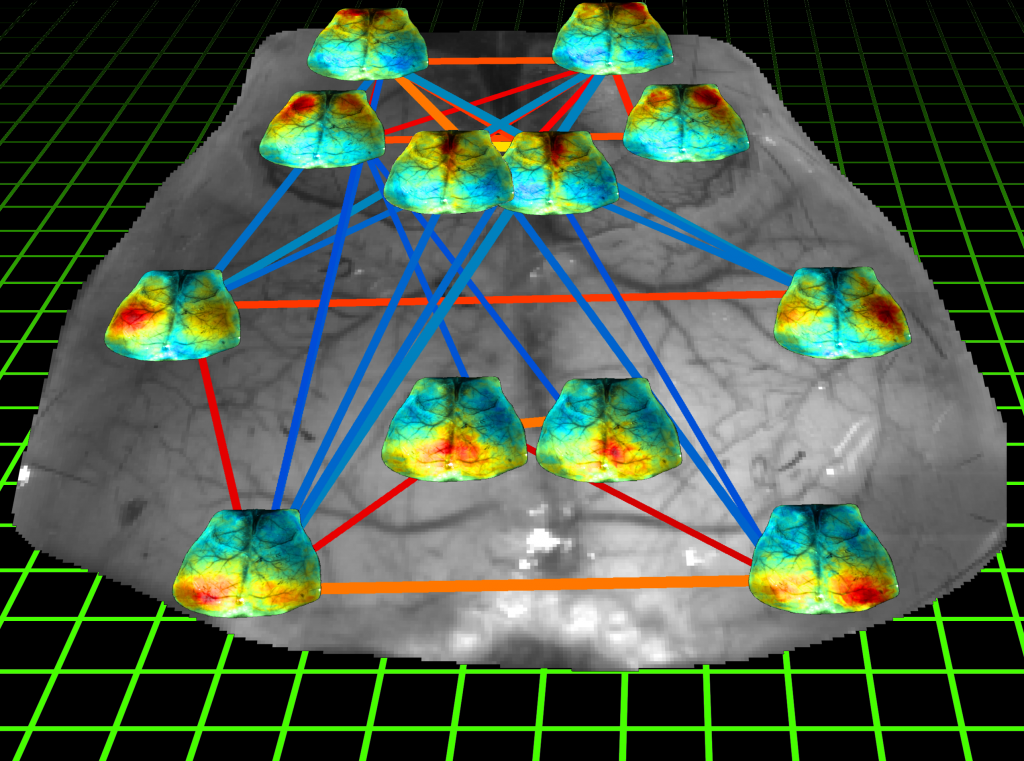
Mouse connectome
Functional connectivity of the mouse cortex assessed by optical imaging of intrinsic signals. Seed-based correlation maps are overlaid each seed location. Connectivity can be represented as a network, where seeds are assigned to nodes and seed-to-seed correlations are represented by edges connecting those nodes. Nodes are interconnected by their corresponding correlation values r. Thickness of the edges is proportional to the strength of connection; hot colors indicate a positive correlation while cold colors indicate anti-correlations. Only edges with |r| > 0.4 are shown.

